The folks at Rstudio have done some amazing work with the shiny package. From the shiny homepage, “Shiny makes it super simple for R users like you to turn analyses into interactive web applications that anyone can use.” Developing web applications has always appealed to me, but hosting, learning javascript, html, etc. made me put this pretty low on my priority list. With shiny, one can write web applications in R.
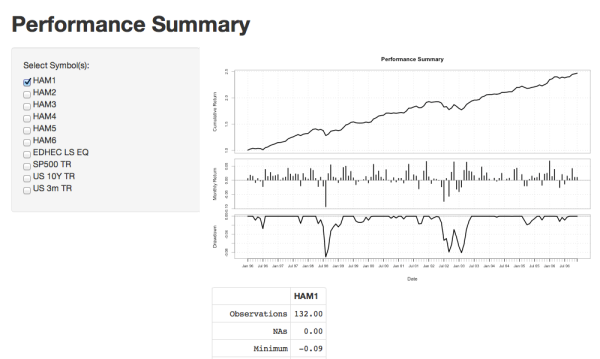
This example uses the managers dataset with calls to charts.PerformanceSummary and table.Stats from the PerformanceAnalytics package to display a plot and table in the shiny application.
Below is a screenshot of the application.

You need to have shiny and Performance Analytics packages installed to run the application. Once those are installed, open your R prompt and run:
shiny::runGist("https://gist.github.com/rbresearch/5081906")
There is a great shiny tutorial from Rstudio as well as examples from SystematicInvestor for those interested in learning more.